This login is for members of The Broadway League, who are primarily theatre owners and operators, producers, presenters, and general managers in North American cities, as well as suppliers of goods and services to the commercial theatre industry.
Consumers looking for ticketing accounts should contact directly the theatre where your account is held.
The Broadway League is the clearinghouse for information on the business, demographics, and economic impact of Broadway theatre throughout North America.
The League compiles various statistics and publishes extensive reports on a number of topics. For brief excerpts from recently published reports, click on the links below.
PDF versions of the reports are available for purchase. Order copies here.
The Demographics of the Broadway Audience
2022-2023 SEASON
The Demographics of the Broadway Audience 2022-2023 is a profile of the audience at Broadway shows from June 2022 through May 2023. It is the twenty-third report in our series, analyzing the composition of the audience today in comparison to past years and attempting to note trends for the future. The report includes information regarding the demographics, ticket purchasing habits, and consumer preferences of the Broadway theatregoer. This marks the return of The Broadway League’s annual report following the COVID-19 pandemic shutdown.
• The 2022–2023 season was the first complete season after the Broadway industry had to shutter in March 2020 due to the COVID-19 pandemic.
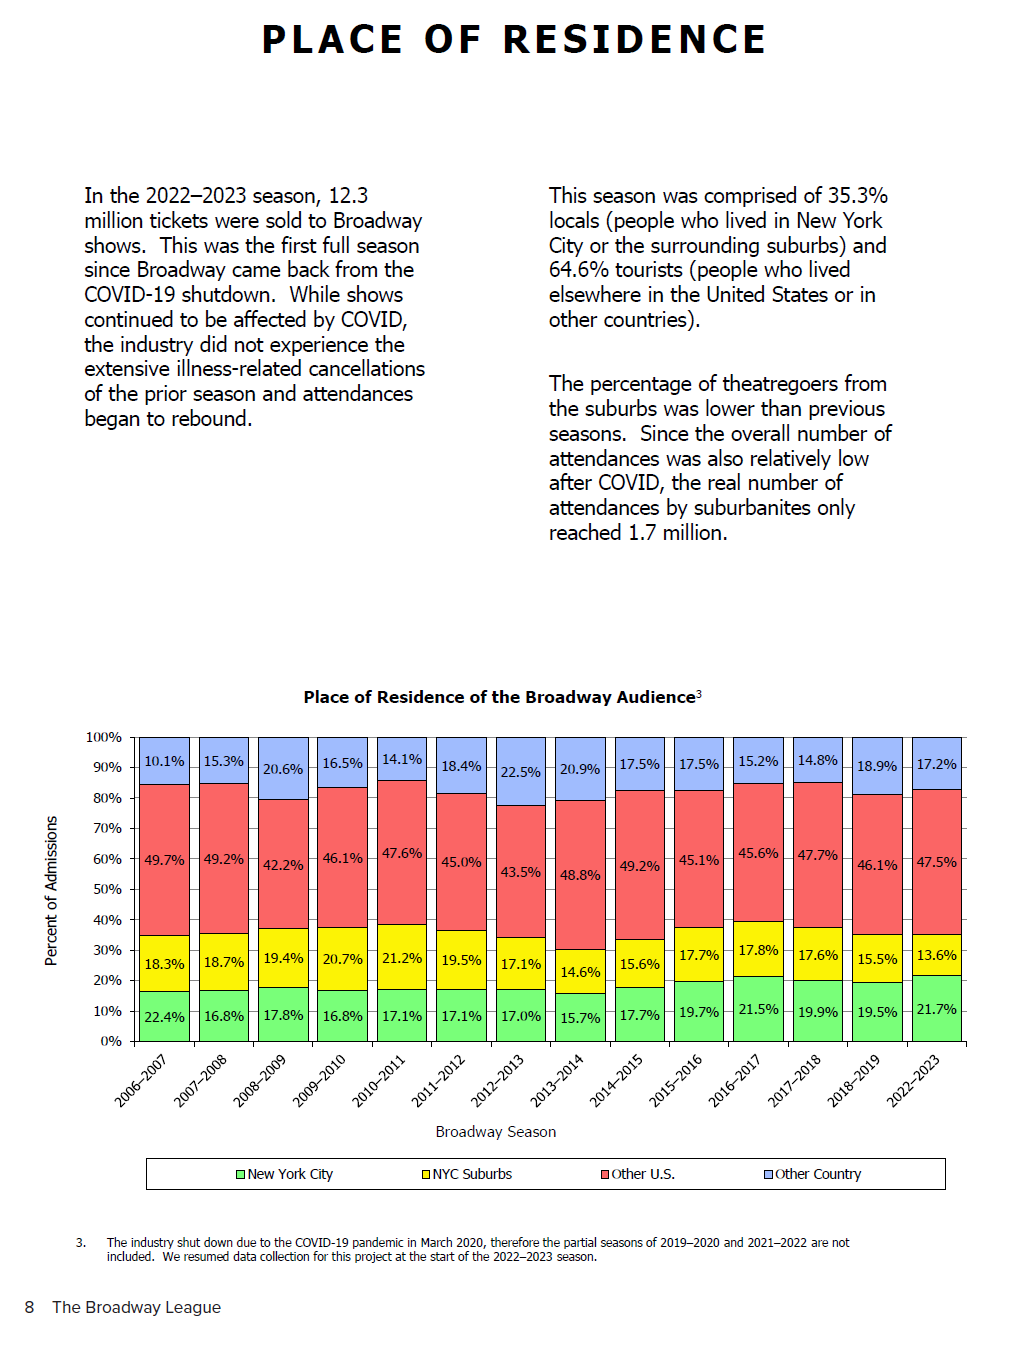
• This season garnered 12.3 million admissions, 16.8% shy of the record-breaking 2018–2019 season pre-COVID (the last complete season before the shutdown).
• Approximately 35% of attendances were by people from the New York City metropolitan area (21.7% from New York City and 13.6% from the surrounding suburbs).
• Another 47.5% were by theatregoers from the United States (but outside New York City and its suburbs).
• Seventeen percent of theatregoers (or 2.1 million admissions) were from other countries. This was comparable with pre-COVID seasons.
• Sixty-five percent of the audiences identified as female.
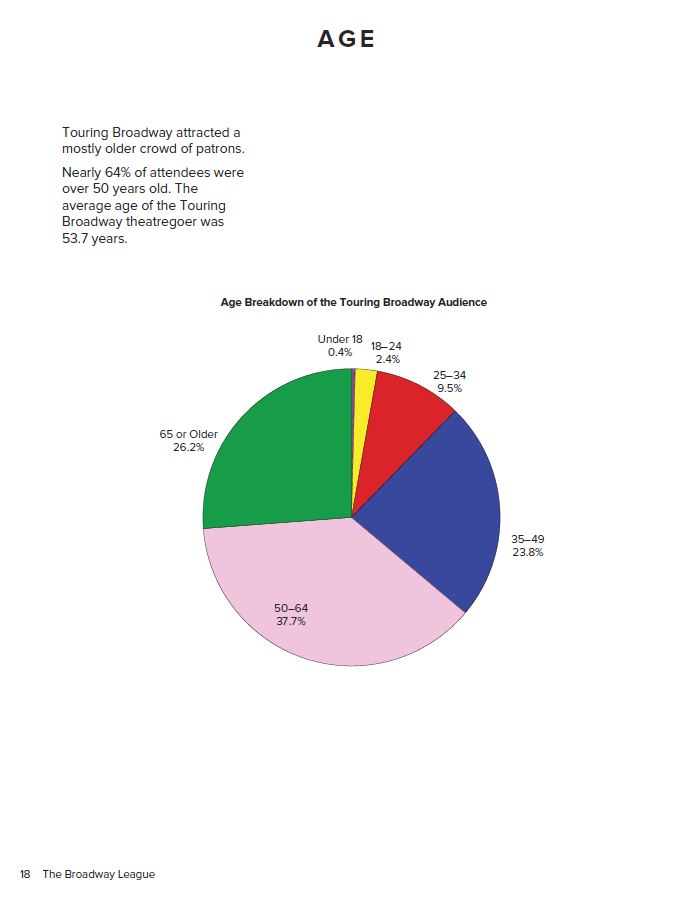
• The average age of the Broadway theatregoer was 40.4 years old. That was the youngest in the past twenty seasons.
• Twenty-nine percent of attendees identified themselves as BIPOC (Black, Indigenous, or People of Color), the highest percentage to date.
• Of theatregoers aged 25 or older, 85.8% had completed college and 43.0% had earned a graduate degree.
• The average annual household income of the Broadway theatregoer was $271,277.
• The average number of attendances by the Broadway theatregoer was four in the past year. The group of devoted fans who attended 15 or more performances comprised only 4.9% of the audience but accounted for 30.2% of all tickets (3.7 million admissions).
• The strongest motivating factors for show selection were the music and personal recommendation.
• The average reported date of ticket purchase for a Broadway show was 34 days before the performance, compared to 47 days in the 2018–2019 season.
• Most theatregoers attended in pairs or small groups of family or friends.
• Respondents reported having paid an average of $161.20 per ticket.
• Ninety-five percent of attendees said they plan to see another Broadway show in the future.
• Twenty percent of theatregoers worked in New York City.
57 pages, illustrated with color charts and graphs. Published December, 2023.
Broadway's Economic Contribution to New York City
2018-2019 SEASON
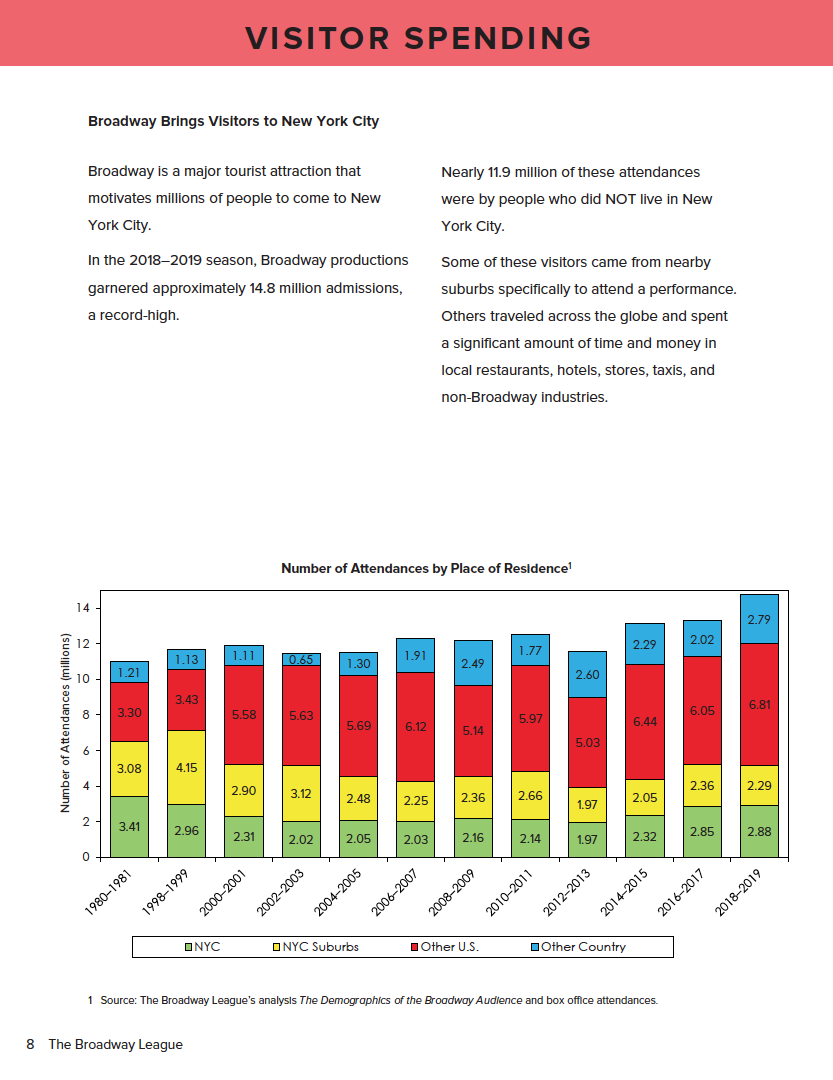
This biennial report analyzes the economic impact of money spent in New York specifically because of Broadway - including dollars spent on mounting and running Broadway productions and maintenance of theatres; as well as monies spent by visitors to New York on Broadway related ancillary spending.
During the 2018-2019 season, the Broadway industry contributed $14.7 billion to the economy of New York City and supported 96,900 jobs.
This amount consisted of direct spending in three areas: spending by producers to produce and run shows; spending by theatre owners to maintain and renovate venues; and ancillary purchases by "Broadway Tourists" (defined as non-NYC residents who said that Broadway was a very important reason for their coming to New York City). The money that was directly spent in these areas was then re-spent in multiple subsequent rounds, until the original sums left New York City. The sum of the subsequent rounds and the original spending total the full contribution of $14.7 billion.
45 pages, illustrated with color with charts, graphs, and photos.
The Audience for Touring Broadway
2017-2018 SEASON
62 pages, illustrated with color charts and graphs, published February 2019.
The Economic Impact of Touring Broadway
2016-2017 SEASON
31 pages, illustrated with color with charts, graphs, and photos.
Published June 2019, revised August 2020


Web Design Company Lounge Lizard
Copyright © 2015-24 The Broadway League. All rights reserved. Legal | Privacy | Terms of Use | Contact